2015 Taobao Challenge Of User Classification
2015 TaoBao Challenge of User Classification
PengyangWang And I participated in a big data challenge game holded by Alibaba in our school,Beijing University of Posts and Telecommunications , in this autumn. This challenge required participants to classify customers of TaoBao,chinese Amazon, into 12 categories based on their online behaviors.Our solution had achieved 34% precision rate. In this article, we prefer to making a summarize of this challenge and our method.
Problem Description
Data Description
This is a Multi classification problem. We are given three files: log_train.csv, info_train.csv,log_test.csv.
Data in file info_train.csv contains Id and class of all users appeared in log_train.csv. The structure of info_train.csv is given in the table below .
| user_id | class |
|---|---|
| 254 | 1 |
| 456 | 3 |
| Col Name | Type | Description | Comment |
|---|---|---|---|
| user_id | int | identify of user | |
| class | int | class of user | number range from 1 to 12 |
log_train.csv and log_test.csv have same data structure .The contents of this two files is user’s online-shopping behaviors during a year. The name and meaning of all colums in this two files is given below.
| user_id | item_id | cat_id | seller_id | brand_id | time_stamp | action_type |
|---|---|---|---|---|---|---|
| 254 | 1034 | 1206 | 1003 | 34 | 173 | 0 |
| 254 | 1498 | 1085 | 1243 | 4241 | 173 | 1 |
| Col Name | Type | Description | Comment |
|---|---|---|---|
| user_id | int | identify of user | |
| item_id | int | identify of item | |
| cat_id | int | Category Id of The Item | |
| seller_id | int | Seller Id of The Item | |
| brand_id | int | brand Id of the Item | |
| time_stamp | int | When The Action Occured | |
| Action_type | int | Type Id of the action | 0-click,1-collect,2-Buy,3-Delete |
TASK
This challenge required participants to classify all the users appeared in log_test.csvinto 12 categories based on user’s online-shopping behavior.
Evaluation
The evaluation method is to calculate the precision rate of classification.The python code can be download here.
Solution
Perception of Question
Costumer’s number of all 12 categories in log_train.csv is given below
| class | 1 | 2 | 3 | 4 | 5 | 6 | 7 | 8 | 9 | 10 | 11 | 12 |
|---|---|---|---|---|---|---|---|---|---|---|---|---|
| number | 12166 | 26830 | 18836 | 10066 | 8981 | 1999 | 6578 | 11915 | 8416 | 4163 | 3536 | 973 |
Class 2 has the highest numbers of users and class12 has the minimum ,only 937 ,users. The total number of users is 114459.
Major diffrences between online-behaviors of 12 classes customer’s
It’s important to understand all the key elements that can influence classification precision rate.According to our usual experience of online-shopping and the data we accessed from this competition,we concluded some potential meaningful features behavior of users:
-
Active Days of User
We defined this term as the total number of days that user has online active record.We calculated activity days of all users in training set and plot the result to visualize the data.The R code to compute the active days of user and the figure of 12 categories activity days are given below.
user_active_days<-sapply(train_user$V1,function(x){length(unique(train_data[train_data$user_id==x,]$time_stamp))})Active Days of 12 Categories
-
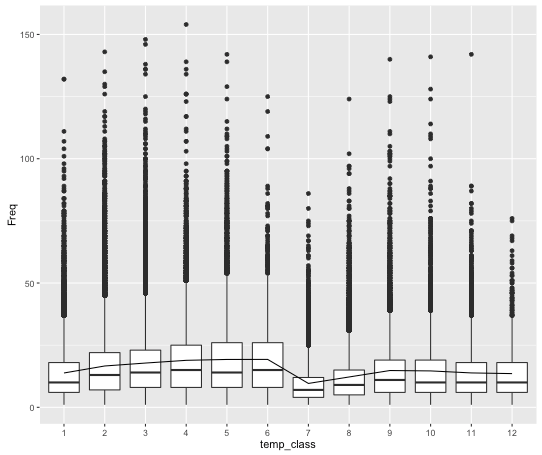
Action frequency of specific period
In China,there are some essential date,such as Singles’ Day,National Day and Valentine’s Day,for online-consumer because of the discount. By analysis the log file, we found that people from different categories have different attitude towards those special date. For example, class 3 and 4 will more active in those period than ordinary days. In contrast, users in class 8 are more calm when faced the on sale.Even there is only a slightly variation between the 12 classes in this feature,but after we split those data into different time intervals,we can achieve a 13% precision rate by using this feature set(buying_frequency,clicking_frequency,action_frequency).
-
The ratio of Action Types in a time range
From the head of this article,we know the action type is divided into 3 types.After analysis,We discovered that it’s really rare for behaviors of colloect and delete. So we ignore this two action type and just focus on the buying_clicking ratio.This ratio is refer to before a customer do a buying action how many clicking action or how many items this user viewed. The formulation of computing the buying_clicking ratio of one period is given below.
-
Brand of consumer goods
Every record in log_train.csv have a feature named brand_idwhich represent the brand related with this action.We just consider buying_action ,we want to use the brand of items people consuming to classify users. We all know that in our life different brands are towards different group of people. So it’s also make sense that people from different categories will buy products from different brands.However,how to connect the brand with user’s categories is a problem.In our case we use K-meanson brand_id feature. K-means is a clustering algorithm in machine learning area. To use this on bran_id we require to construct a dataframe of brand_id.The dataframe is given below.Our data frame has 13 features, the first column is brand_id and the other features are the buying proportion of specific class users in 12 categories. There are 6304brand in this data.
Brand DataFrame brand_id \(C_1\) \(C_2\) \(C_3\) \(C_4\) \(C_5\) \(C_6\) \(C_7\) \(C_8\) \(C_9\) \(C_{10}\) \(C_{11}\) \(C_{12}\) 234 0.2 0.1 0 0 0 0.4 0 0 0 0 0 0.2
After we construct this dataframe ,we are using K-meanson Brand DataFrame .R code of this process is given below.
getKmeans_brand<-function(log,k)
{
brand_class<-table(log$brand_id,log$class)/rowSums(table(log$brand_id,log$class))

brand_kmeans_k<-kmeans(brand_class,centers = k)

brand_id<-rownames(brand_class)
brand_kmeans_k<-data.frame(brand_id,brand_kmeans_k$cluster)
return (brand_kmeans_k)

}
After we cluster brand into 14 calsses,then we update brand_id with their newest calss_id.
- Category of consumers goods We also adopt same process on the categories of item as well as brands of item.The idea is as the same as we propose in previous part.
Data processing
All the R code of clean data process can be found here.
clean_data<-function(log,time=1:185,kmeans_k=6,user.all,brand_kmeans,cat_kmeans)
The argument time in clean_data function can split the whole log_train.csv into different part by time interval as your wish.We give a invoking example below.
 train_t1<-clean_data(log_train,time = 1:10,user.all = get_user(log_train),brand_kmeans = brand_kmeans,cat_kmeans = cat_kmeans)
  train_t2<-clean_data(log_train,time = 11:40,user.all = get_user(log_train),brand_kmeans = brand_kmeans,cat_kmeans = cat_kmeans)
  train_t3<-clean_data(log_train,time = 40:100,user.all = get_user(log_train),brand_kmeans = brand_kmeans,cat_kmeans = cat_kmeans)
  train_t4<-clean_data(log_train,time = 100:185,user.all = get_user(log_train),brand_kmeans = brand_kmeans,cat_kmeans = cat_kmeans)
  final_train<-merge_data(train_t1,train_t2,train_t3,train_t4)
In the above code, we split the whole 185 days into 4 parts.We also combine all the feature in 4 parts together by a merge_data function.
merge_data<-function(data1,data2,data3,data4,data5,data6,data7)
{
final_log<-merge(data1,data2,by.x="user_id",by.y="user_id")
final_log<-merge(final_log,data3,by.x="user_id",by.y="user_id")
final_log<-merge(final_log,data4,by.x="user_id",by.y="user_id")
final_log<-merge(final_log,data5,by.x="user_id",by.y="user_id")
final_log<-merge(final_log,data6,by.x="user_id",by.y="user_id")
final_log<-merge(final_log,data7,by.x="user_id",by.y="user_id")
#final_log<-merge(final_log,data7,by.x="user_id",by.y="user_id")
return(final_log)
}
we got our final dataframe final_train.Then we start to construct a classification model.
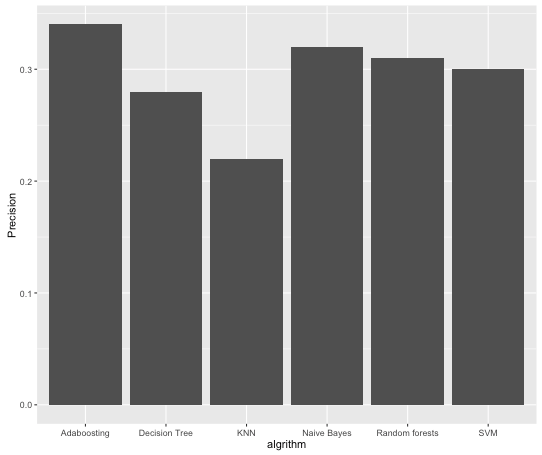
Modeling
We have tired many classification algorithm like Naive Bayes,Decision Tree,SVM ,Random forests,KNN and Adaboosting.We found that when using 5 descision trees in Adaboosting we got highest precision rate 34%.The modeling code can be found here.